A new gender equality dashboard, created by the Champions of Change Coalition, is giving boards insights into the systematic drivers behind pay gaps, including hiring patterns, bonus allocation and cultural signals.
Boards are now expected to ensure their organisations not only measure but also actively close gender pay gaps. While most leaders now track high-level metrics, such as the average gender pay gap, the headline figures often obscure the drivers that sustain inequity.
A new organisational gender equality dashboard, created by Champions of Change Coalition, offers a sharper, board-ready view – one that goes beyond compliance to show where systemic barriers are embedded in workplace design.
Transparency at this level is essential, says Elizabeth Broderick AO, the coalition’s founder.
“We want to help leaders get to the heart of the issues faster, ask better questions and stay accountable for progress.
“No organisation can solve the challenge of gender pay gaps alone. Wide adoption of this measurement approach can support organisation, sector and national efforts to close gender pay gaps.”
Surfacing the why behind the gap
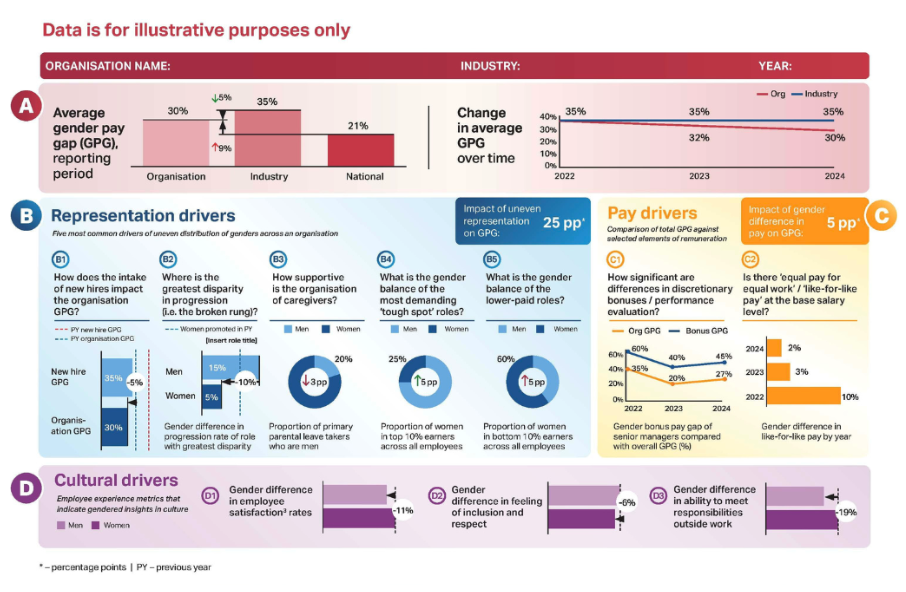
At first glance, the dashboard (below) resembles a traditional reporting tool. It highlights the organisation’s gender pay gap alongside industry and national benchmarks. But its real value lies in surfacing the ‘why’ behind the numbers.
For example, representation drivers show where progression stalls, how new hire practices affect pay equality and whether caregiving responsibilities are equitable.
For boards, this multidimensional approach turns abstract values into tangible governance questions and can lead to much stronger organisational outcomes.
Download a printable version here.
“Boards need clarity at both levels,” says Sandra Hu, Program Director at Champions of Change Coalition. “A headline pay gap figure shows there’s an issue, but without unpacking the drivers, you don’t know where to act.
“The dashboard bridges this by providing a high-level overview alongside 10 evidence-based metrics showing whether progression stalls, if bonuses are equitably distributed or if culture is inclusive. Boards can now track the big picture and focus their questions where it matters most.”
Representation versus pay drivers of gender inequality
The dashboard also distinguishes between representation drivers (who is in which roles) and pay drivers (how people are rewarded).
For example, boards can interrogate whether discretionary bonuses or performance evaluations are skewing results, or whether ‘equal pay for equal work’ is being realised in practice. By quantifying these elements, the tool highlights where cultural narratives about fairness may not match financial reality.
“Looking at the top and bottom 10 per cent of earners quickly reveals where inequality sits. You might be meeting leadership targets overall, but if women are missing from the highest-paid roles, it shows how value and opportunity are unevenly shared,” says Hu.
The dashboard also tracks cultural indicators – differences in employee satisfaction, inclusion and ability to manage responsibilities outside work. These qualitative signals remind boards that pay equity is inseparable from workplace culture.
Culture is often the missing piece when boards look at the gender pay gap which, when broken down numerically, suggests gaps are purely driven by uneven gender representation or gendered differences in remuneration.
“We want to help leaders… ask better questions and stay accountable for progress.” – Elizabeth Broderick AO, Founder, Champions of Change
“However, it’s not only about numbers, but whether there are gendered differences in experiences,” says Hu.
“HR leaders can use cultural indicators to show directors that workplace design directly influences retention, engagement and risk. Framing culture as both a driver of gender equality and a business risk makes it a core governance issue.”
This framework helps boards move past retrospective reporting into forward-looking strategy – asking not only what the pay gap is, but why it exists and how it can be closed.
“The ‘what’ is the headline figure, and the ‘why’ is the diagnosis of drivers, but real change comes from the ‘how’,” she says. “It comes from HR leaders who embed this dashboard in strategy, planning cycles and organisational reporting to ensure it drives action at every level.”
Download a printable version here.
Other resources:
- HR’s guide to preparing a board report
- How to use data to make your presentations more impactful
- A glossary of boardroom terms to enhance your executive influence
- Podcast: a guide to navigating boardroom dynamics
- Professional development: Women in HR leadership
Download the Champions of Change’s full dashboard with additional details included, such as a template to create a proposed action plan after identifying any gender pay gaps. A version of this article first appeared in the October/November 2025 edition of HRM Magazine.